|
|
Good development practices also involve debugging applications as you develop them.
During the last chapter, there was nothing on your application page to debug. But now, there is a query that is not being output to the page.
When developing and debugging applications, you will want to enable debugging options for ColdFusion Server so that you can view run-time information about:
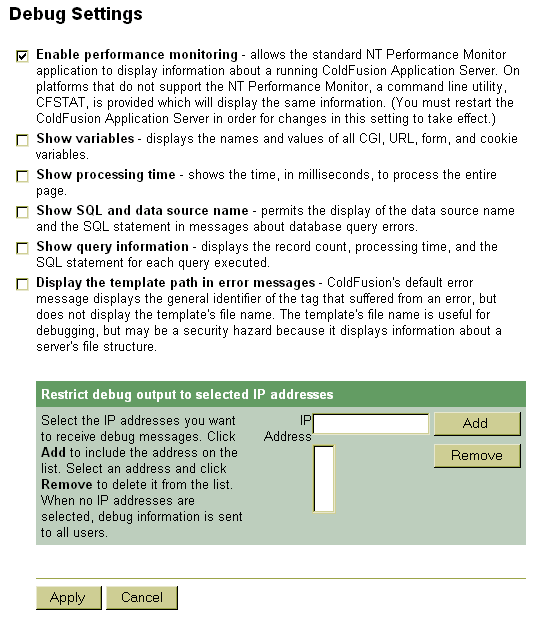
Enable debugging within the ColdFusion Express Administrator.

| Note: | There are several debugging options that you can set for ColdFusion Server. Refer to Chapter 13, Configuring ColdFusion Express Server for additional detail. |
| To enable ColdFusion Server debugging: |
The Administrator prompts you for a password if you assigned one to ColdFusion Server during install.
SHOW VARIABLES
SHOW PROCESSING TIME
SHOW SQL AND DATA SOURCE NAME
SHOW QUERY INFORMATION
Debugging is enabled.
Move on to view debugging information.
EmpList.cfm in your browser.You should see query properties, the SQL used, Data Source Name, and processing time displayed.
Move on to the next heading to learn how to output query data to a page.